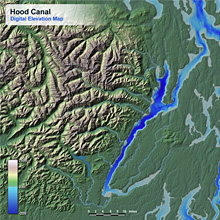
Visualization and Illustration
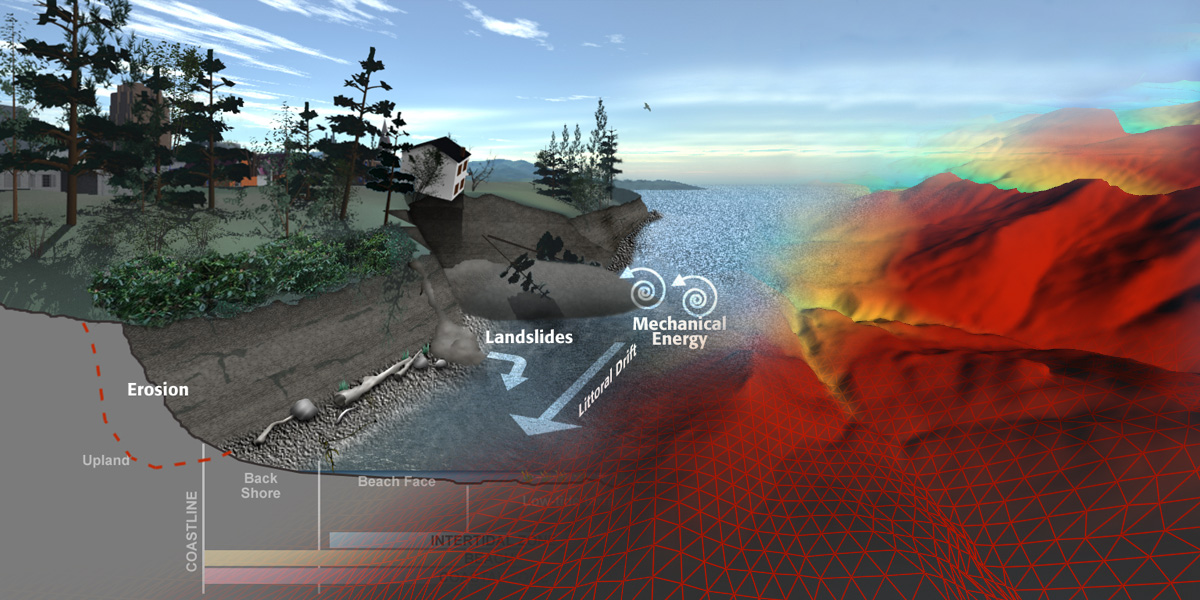
Seeing Puget Sound in a new way
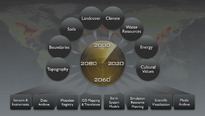
A new effort in the visualization of Puget Sound data sets is currently underway via a PRISM partnership with the Center for Environmental Visualization. The goal is to provide a new means for researchers and students to visually explore Puget Sound model output and related data sets. The approach is to automatically produce and distribute visualization products created from numeric models and observational data using the latest scientific workflow technologies combined with a new Collaborative Ocean Visualization Environment (COVE). This combination is intended to provide an interactively controlled visualization pipeline for producing 3D animations of Puget Sound data.
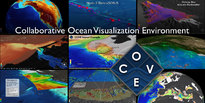
Collaborative Ocean Visualization Environment
COVE is 3D Visualization software for working with geo-referenced data, initially developed under an NSF ITR Grant for the Ocean Observatory community. The main architect/developer is Keith Grochow, a PhD student of Ed Lazowska, Department of Computer Science and Engineering. COVE has many of the features of Google Earth, however, it has been specifically designed to work with scientific data-sets including netCDF model output.
Scientific Workflow
Microsoft has under development new scientific workflow software that is specifically targeted at Ocean and Earth Science. This is part of their Technical Computing effort. Their goal is to provide a toolkit/workbench that would allow scientist to construct workflows for processing, analyzing and visualizing their data. This workflow technology couple with COVE provides the basis for a visualization pipeline.
Visualization Examples
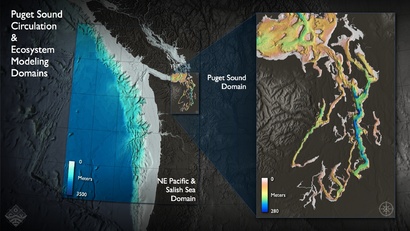
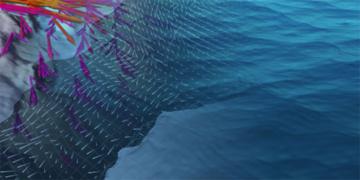
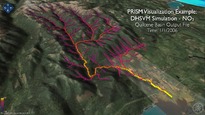 Visuals of model output and observations across Puget Sound will be produced as part of the visualization effort. These include inputs and outputs from PRISM related numeric models such as ROMS, DHSVM, and WRF. An ongoing effort to determine what visuals and visualization practices are best suited for researchers, students and decision makers is part of the this process.
Puget Sound Science Illustration
In addition to scientific visualizations of Puget Sound datasets, CEV has partnered with PRISM to develop science illustrations of earth and ocean processes. These illustrations are used for presentations and educational activities.
Google Earth / Ocean
With Google Earth's recent addition of below sea-level data, new opportunities exist for displaying integrated PRISM datasets. As part of PRISM overall technology efforts model output will be produced in KML layers to be displayed in a number of publicly available geo-browsers. Note COVE is also set up to interactively develop scientific visualizations that can be exported as KML image layers.
