Validating the circulation model
Comparing observations versus simulated Puget Sound
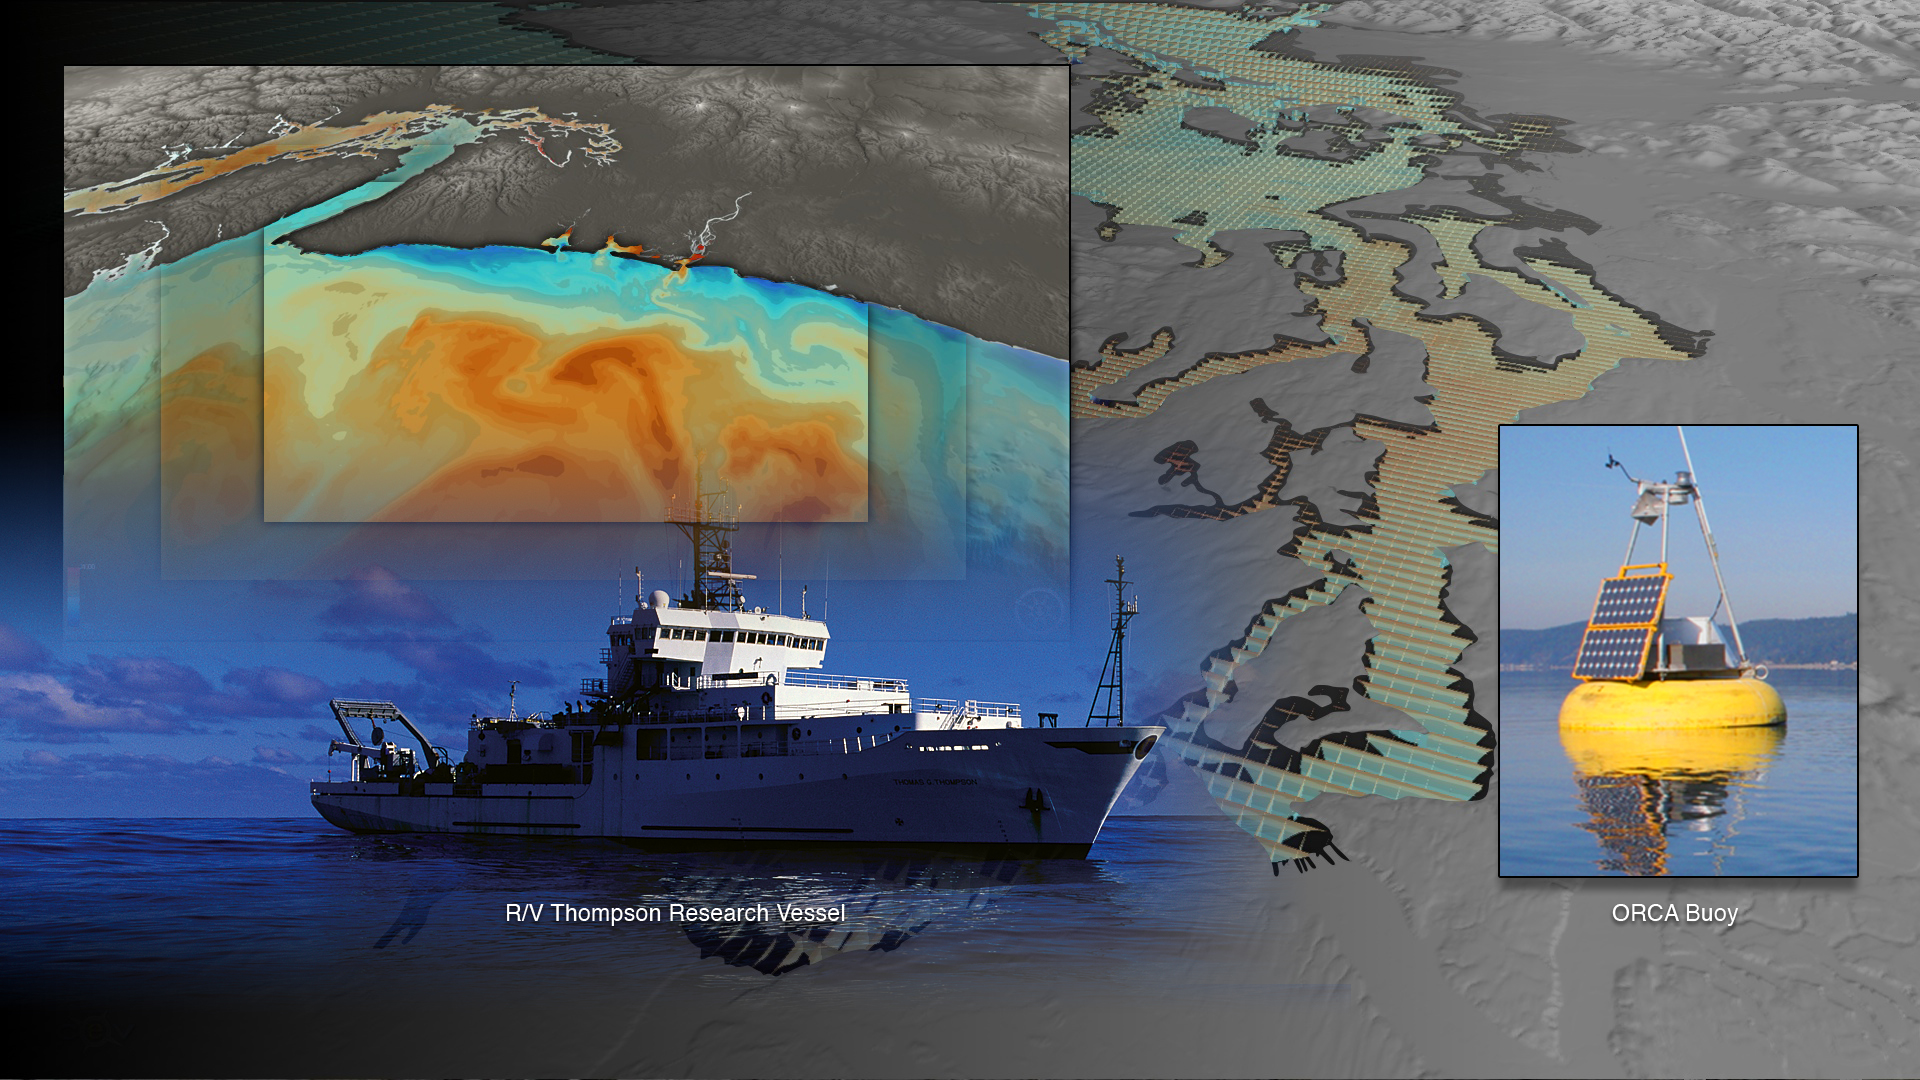
Before being used to answer quantitative scientific questions, the Puget Sound circulation model is undergoing rigorous validation against a number of observational data sets. The variables we examine include velocity, temperature, salinity, and sea surface height, and we test their robustness with the same model variables over a range of time and space scales. For instance, we use tide gauge data from 10 NOAA stations around the region to see if the sea surface height field is correct in its amplitude and phasing. Other observations come from regular monitoring programs around the Sound, such as the bi-annual PRISM cruises, or from moored instruments from projects like RISE or ECOHAB that give us valuable time-series data to test against.
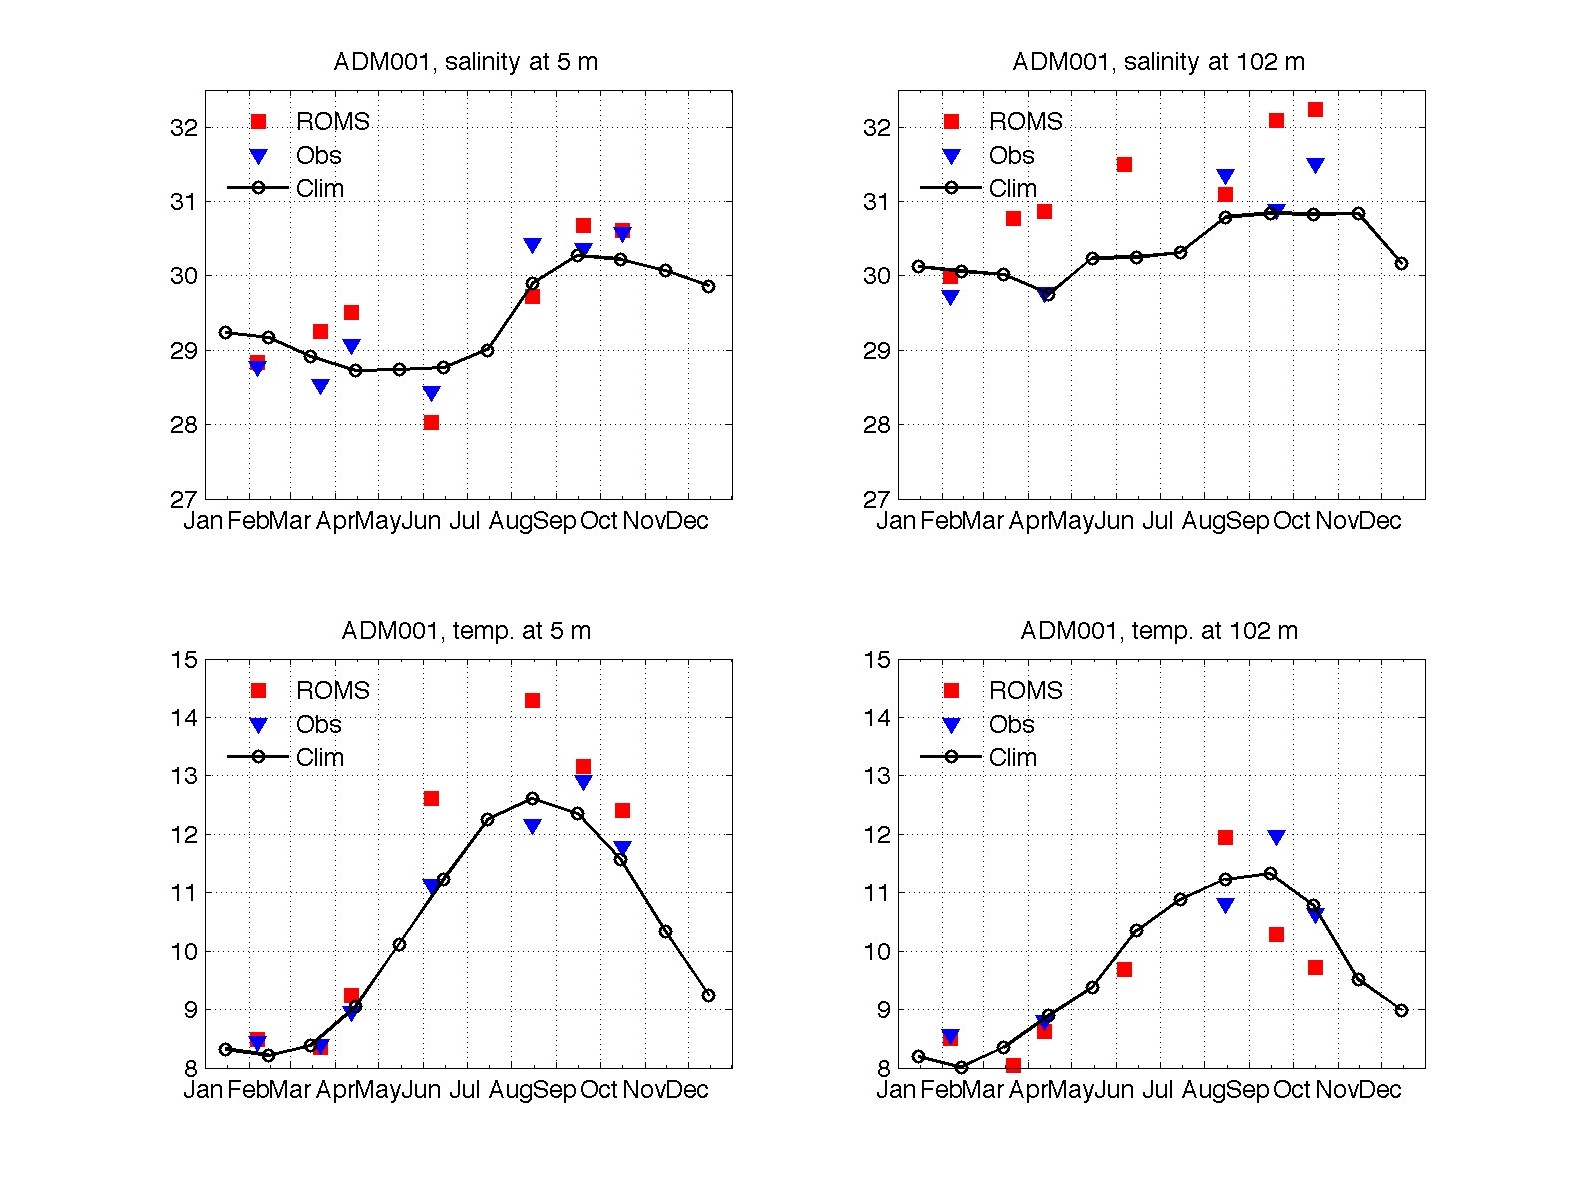
The following plot shows an example of one CTD station comparison taken from the PRISM cruise in June 2006 in Admiralty Inlet (station 21). Monthly monitoring programs sustained by the Department of Ecology allow us to compare seasonal variability at select locations around the Sound as well, including one near this station. See this plot for an example of this model-observation comparison.

Time series of velocity comparisons, salinity, and temperature inside Puget Sound and on the WA shelf can be seen at the website http://faculty.washington.edu/dsuth/MoSSea/.
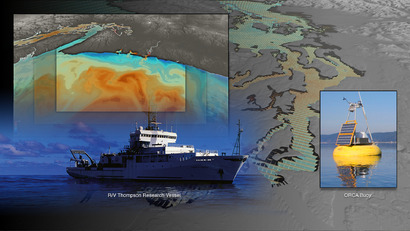
One example of a time series plot is shown below, which compares the low-pass filtered velocity at a station near the Strait of Juan de Fuca mouth (ECOHAB mooring #1) with the model velocity fields during a select time in 2006.
