Lab 3: Visual Puget Sound
Lab 3: Visual Puget Sound Model
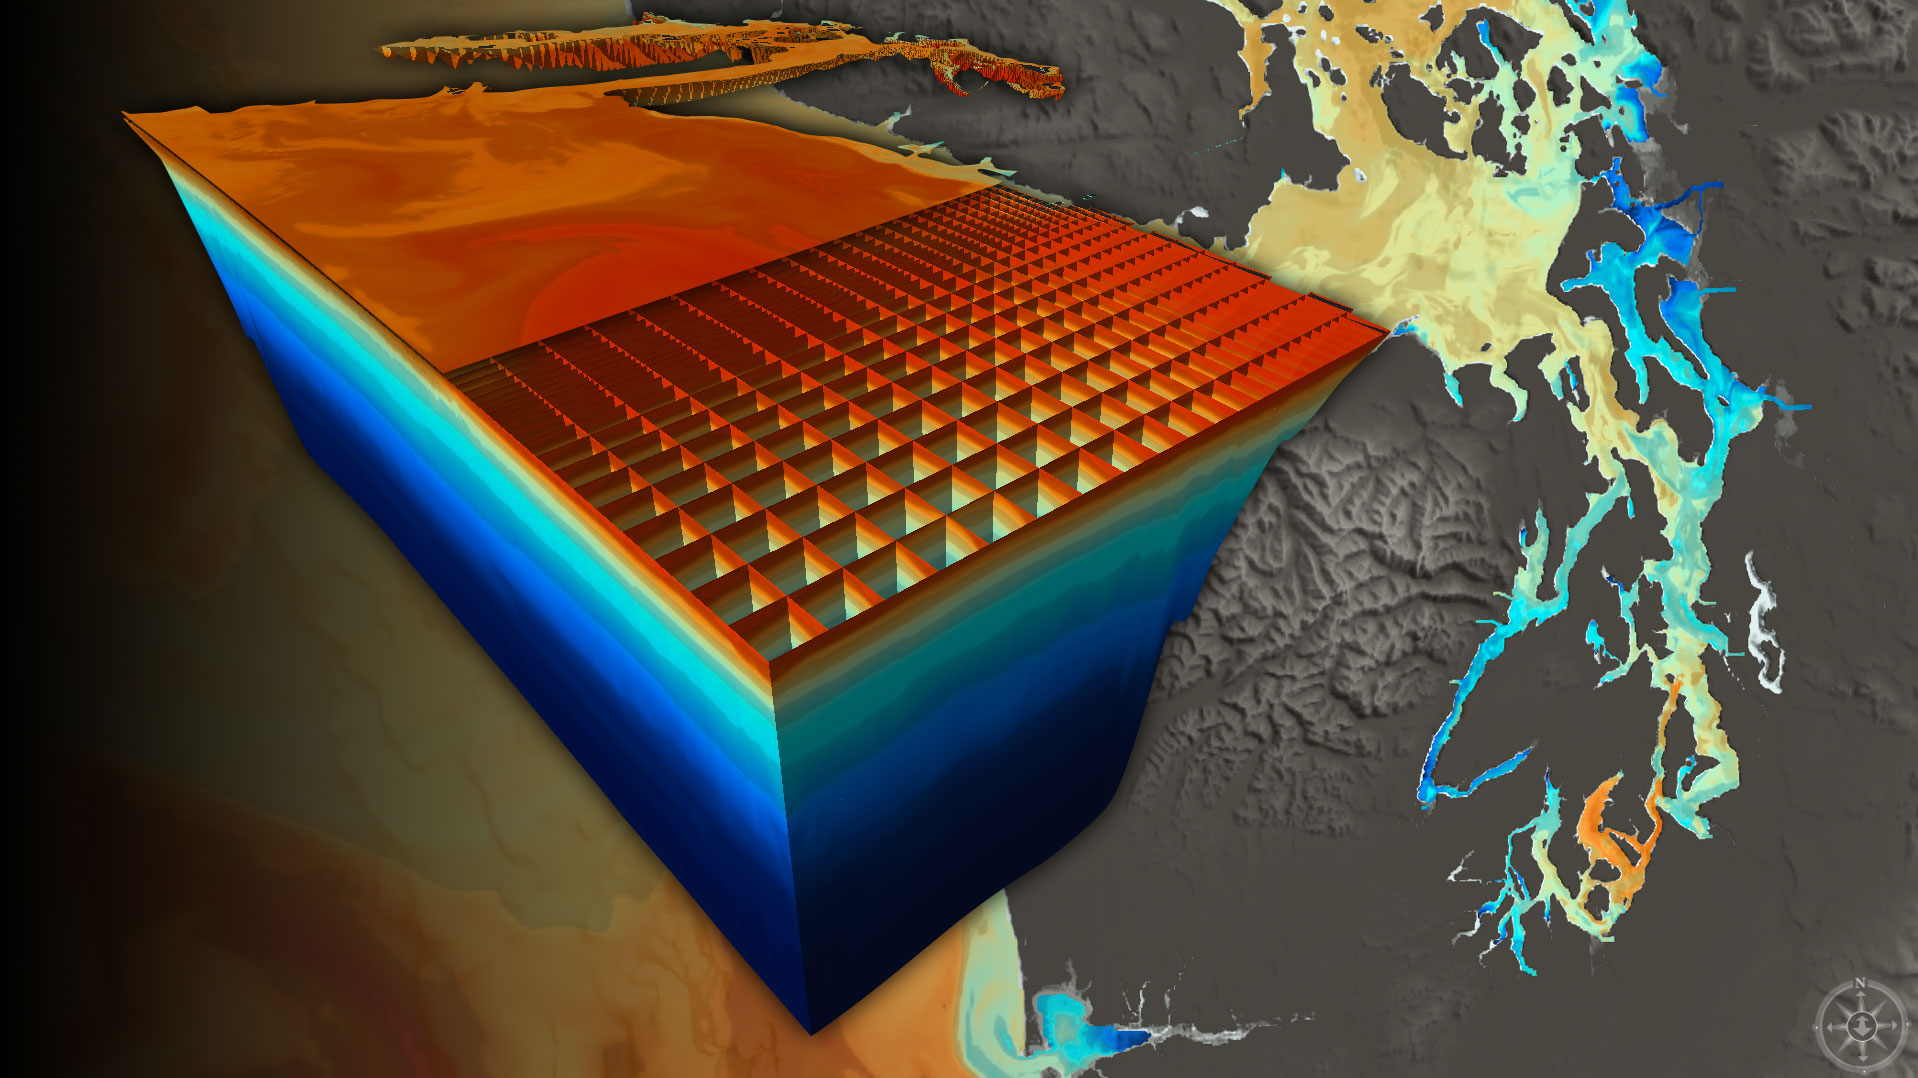
During this lab exercise we will explore a computerized model of the Puget Sound Basin. We will use the Collaborative Ocean Visualization Environment (COVE), which is being developed at UW, to visualize various oceanographic datasets. We will explore oceanographic properties in Puget Sound such as temperature, salinity and circulation. The interface allows you to choose a wide range of views of simulated data that were generated previously by another model.
Our goal for this lab is to understand how these physical parameters interact to create oxygenated versus anoxic conditions in the water column. Specifically, we are interested in understanding the physical oceanographic mechanisms responsible for the low levels of dissolved oxygen in Hood Canal. By comparing different sites throughout the Sound, you will be able to visually comprehend how water stratification and flushing rates (the two major physical causes of the O2 problem) affect these properties.
The geology and bathymetry of Hood Canal play a large role in the water quality and dynamics of how the water moves. The entrance to the canal is a relatively shallow sill, but just south of the entrance the canal becomes very deep. This sill at the entrance creates a condition in the canal that doesn’t allow deep water to flow or exchange very easily with the changing tides and seasons. Flushing rate in the canal is on the order of 1-2 years, while outside the Canal in the Main Basin the flushing rate is 2-3 months.
Reading materials for this lab: